


Example of a column and a micro separator
Dimensions in millimeters
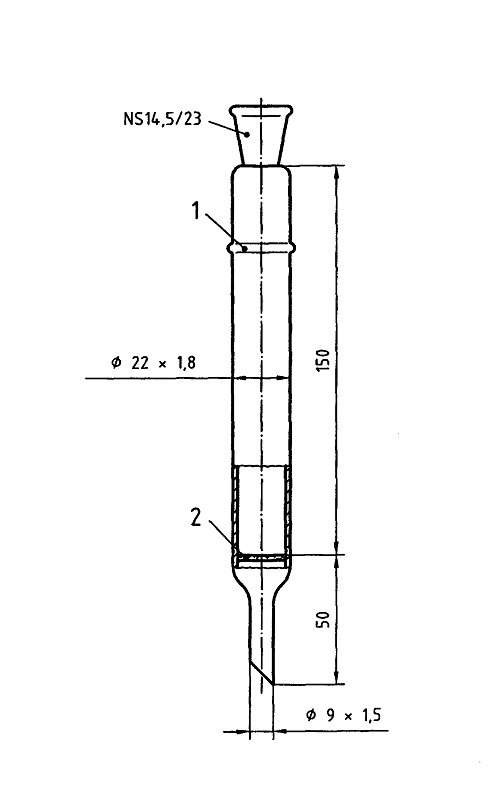
Key
1 Glass bulb
2 Fritted glass filter
Figure A.1 – Example of a column
Annex B
(informative)
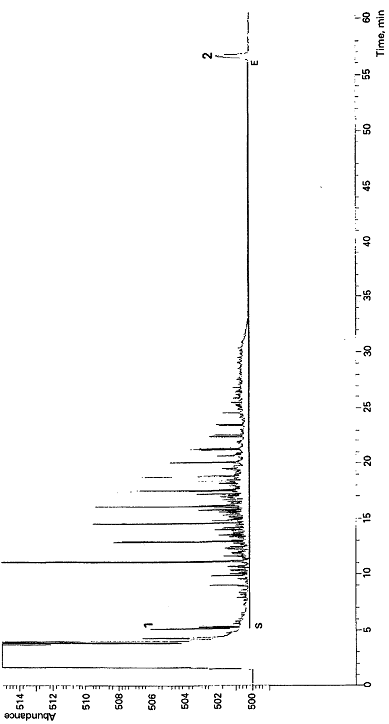
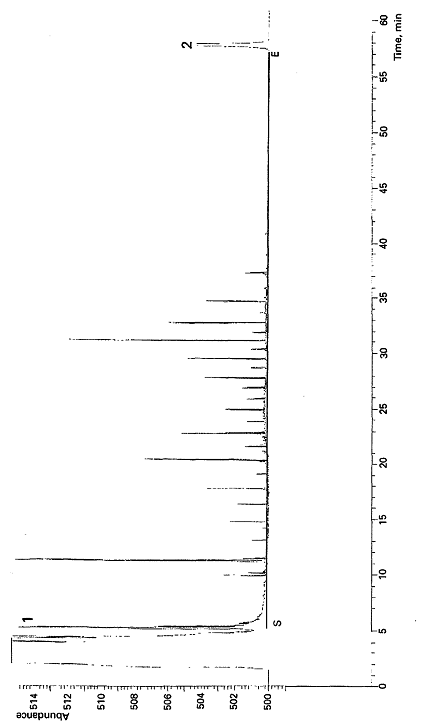
Examples of gas chromatograms of mineral oil standard and water samples
The gas chromatograms have been recorded under the following conditions:
Injection technique: programmed temperature vaporization (PTV)
Injection temperature: 50 °C to 300 °C
Injection volume: 1 μl
Column length: 30 m
Column internal diameter: 0.25 mm
Liquid phase: DB 5 MS
Film thickness: 0.25 μm
Pre‑column: deactivated fused silica capillary
Carrier gas: hydrogen
Carrier gas pressure: 0.8 bar
Oven temperature programme: 40 °C for 5 min, 10 °C/min to 300 °C, 300 °C for 20 min
Detector: flame ionization detector
Detector temperature: 300 °C
Make‑up gas: nitrogen
Make‑up gas flow: 25 ml
Key
1 n-Heptane
2 n-Tetracontane
Figure B.1 – Gas chromatogram of a standard solution (0.5 mg/l)
Key
1 n-Heptane
2 n-Tetracontane
Figure B.2 – Gas chromatogram of a surface water contaminated with fuel oil
Figure B.4 – Gas chromatogram of a waste water contaminated with lubricating oil
Example of the instrumental conditions for the determination of dispersed oil in produced water by gas chromatography
Apparatus and conditions
- Gas chromatograph: Trace GC 2000
- Precolumn: 10m * 0.53mm Fused silica coupled with
5m * 0.53mm * 0.5μm CP-SIL 8CB
- Analytical column: CP-SIL 5CB (25m * 0.32mm * 0.4μm)
- Carrier gas: Helium
- Flow rate: 3.0 ml/min (constant flow)
- Injection volume: 50 μl
- Injection speed: 4 μl/sec
- SVE time: 0.05 min
- Extraction liquid: n-pentane
Temperature programme
n-Heptane and benzene (if possible) shall be fully separated from the extraction solvent n-pentane.
The following programme has been used:
Fig B.5 Temperature programme
Annex C
(informative)
Determination of boiling range of a mineral oil from the gas chromatogram
Table C.1 shows the boiling points of the n‑alkanes containing between 2 and 44 carbon atoms (up to and including C44). Using these boiling points, it is possible to determine the boiling range of the mineral oil by comparing the gas chromatogram of the calibration mixture of n‑alkanes with that of the sample extract.
Table C.1 ‑ Boiling points of n‑alkanes
|
Number of carbon atoms |
Boiling point °C |
Number of carbon atoms |
Boiling point °C |
|
2 3 4
5 6 7
8 9 10
11 12 13
14 15 16
17 18 19
20 21 22 |
-89 -42 0
36 69 98
126 151 174
196 216 235
253 271 287
302 317 331
344 356 369
|
23 24 25
26 27 28
29 30 31
32 33 34
35 36 37
38 39 40
41 42 43 44 |
380 391 402
412 422 432
441 450 459
468 476 483
491 498 505
512 518 525
531 537 543 548 |
Bibliography
[1] EN 590:1998, Automotive fuels ‑ Diesel ‑ Requirements and methods of test.
[2] KVERNHEIM A.L. et al., Development of a new hydrocarbon index for oil‑in‑water. Chemosphere, 39, 1999, pp. 2707‑2722.
Annex D
UK Comments on the OSPAR Reference Method
While the OSPAR Reference Method is the standard to which laboratories must base their in house method, it is recognised that the reference method has been implemented differently by laboratories while still conforming to the principles of the reference method. The following comments or recommendations are based upon discussions with laboratories who took part in the DECC Round Robin and may provide information to allow laboratories to improve on their in house methods.
Note: Numbered references below refer to the section number within the OSPAR Reference method.
6 Reagents
6.8.1 Mixture of Mineral Oils, Type A & Type B
A variety of mineral oil mixtures are currently being used, some ready-made with 50:50 gravimetric concentrations and some gravimetrically prepared in house Either is acceptable.
Some labs are spiking the standard solution with individual TEX components so as to better identify these peaks and remove them from the overall integration.
7 Apparatus
7.3 Column for Gas Chromatography
Columns typically used in the UK are:
25 or 30m length
0.32mm Internal diam.
0.25µm, 0.4µm or 0.52µm film thickness
Pre-columns are not always used, but where they are 5m, 0.53mmID deactivated silica ones are used.
7.8 Microseparator
The microseparator as shown previously in Figure A.2., Annex 2 of the Reference Method does not work in the configuration shown and has been removed from this this document. Although one UK laboratory has corrected the design of the microseparator to work, the majority of laboratories decant the mixed solvent/water sample to a separating funnel and running off the water. This is acceptable to DECC.
9.3 Extraction Procedure
The OSPAR method calls for 30 minute stirring using a magnetic stirrer, though no guidance on stirring speed is provided. Laboratories have opted to set the stirring speed such that the vortex reaches the bottom of the sample bottle as long as stirring is steady. Some laboratories vigorously hand shake the sample bottle with pentane for 2 minutes. Either option is acceptable to DECC, though there is some feedback from laboratories that vigorous hand shaking gives higher recoveries than using a magnetic stirrer. Laboratories are required to demonstrate that extraction efficiency is >90% for whichever method is taken.
Additionally, some labs are cooling samples prior to extraction, and during extraction to minimise solvent / light end losses.
9.4 Clean-up Procedure
A variety of actions are being taken from use of clean-up columns as described to pre-charged florisil cartridges to filter paper with florisil. There appears to be no impact on option chosen, though use of a clean-up column or pre-charged florisil cartridges will ensure better contact between the solvent and florisil. It should be ensured that the florisil used is activated.
9.7.4 Integration Parameters
Unlike normal gas chromatography where integration is typically from baseline to baseline, the OSPAR reference method requires integration of the chromatogram in a different manner.
To be compliant with the OSPAR method, integration of the chromatogram, for both calibration standards and samples, should be from just after the n-heptane peak and end at the start of the n-tetracontane peak. Additionally, the integration must be at the signal level in front of the solvent peak (pentane) and be at the same signal level when integration finishes just before the beginning of the n-tetracontane peak.
Previously, Annex B of the OSPAR Method (and this document) showed a number of chromatograms from the original ISO 9377 method used for C10 - C40 analysis, hence S (solvent peak) is indicated incorrectly for the ISO 9377-2 mod method.
These chromatograms have now been adjusted for purposes of this document, to correctly identify S as the heptane peak. Integration should start at the end of the heptane (C7) peak, at the signal level before the pentane peak, and continue until the start of the n-tetracontane (C40) peak, at the same signal level.
For removal of the TEX components from the chromatogram, the TEX peaks should be assumed to extend to the baseline of the signal level before the pentane peak.
11 USE OF ONLINE OIL IN WATER ANALYSERS
11.1 Introduction
The use of online monitors for analysis of oil in produced water can offer many benefits to operators of offshore oil and gas platforms. These include:
(a) Knowledge of the ‘true’ extent of oil to sea discharges.
(b) Continuous process information on oil in produced water (as opposed to relying on twice daily analysis results).
(c) The possibility of ‘real time’ monitoring of discharged quantities of oil if linked to a produced water volume meter.
(d) Reduction in the usage of, and analyst exposure to, solvents.
(e) Allowing an operator to spot process upsets quickly, therefore minimising oil to sea pollution events.
(f) Reduction in sampling and analysis work for offshore laboratory personnel.
Should approval be sought for the installation of an online monitor for reporting purposes, the following sections are intended to provide operators with guidance on what information DECC requires. Other strategies may be acceptable but would be subject to DECC approval.
11.2 General approach
A DECC approved alternative oil in water analysis method (see Section 6 and 7) must be selected before an online monitor is fitted on an offshore installation.
11.2.1 Requirement for Calibrated Alternative Analyser
A calibrated bench top based alternative method that has been correlated against the OSPAR Reference Method will be required when considering using an online monitor. An alternative analysis method is needed for:
(a) Reporting / monitoring purposes whilst an online analyser is in the process of being approved.
(b) Correlating the alternative method against the online monitor.
(c) Validating the performance of the online monitor.
(d) Use as a back-up system in case the online monitor breaks down or fails to produce valid results.
11.2.2 Procedure for the implementation of an online monitor:
(a) Select and procure a suitable online monitor.
(b) Install the monitor in accordance with manufacturer and/or vendor’s instructions.
(c) Establish a correlation by analysing duplicate field samples by both the online monitor and the calibrated alternative method.
(d) Check correlation on a weekly basis.
(e) Update correlation graph on a monthly basis.
(f) Collect and process data for reporting purposes.
11.3 Specific Issues
11.3.1 Installation
Online oil in water analysers should only be installed where they can be easily accessed. It is important that where online systems require the installation of a probe into the main produced water flow line, the location ensures that the probe is exposed to representative flow conditions. If the online monitor is installed on a by-pass line, then the length of the sampling line should be kept to a minimum (see also sections 5.2 & 5.3).
11.3.2 Sampling
It is important that there is an appropriate sampling device fitted so that parallel produced water samples can be collected (see 5.2 & 5.9) and analysed by the calibrated offshore alternative method. Taking samples from the sampling device must not affect the online monitor’s performance / analysis in any way.
11.3.3 Correlation
Following the installation and commissioning of an online monitor, correlation using field samples should be carried out. Refer to Appendix B as an example.
As a minimum, 10 correlation data points should be obtained over a discrete time period, at least one hour apart. For each of the 10 data points, samples should be taken in triplicate and analysed by the approved alternative method and an average value obtained for each data point. The average alternative analysis value for each data point is then compared to the average value that the online analyser reported over the time period during which each set of triplicate samples were taken.
If possible, samples should be taken to cover the typical range of oil in water concentration (0-40mg/l) and should be taken at a time when the process is expected to be reasonably steady.
11.3.4 Construction of a correlation graph
A correlation graph is generated by plotting the average readings from the online monitor against the average values from analysing the field samples using the approved method. Linear regression is carried out on the data points with the 95% confidence intervals calculated using a statistical software package.
A calibration graph with the 95% confidence intervals shown should then be printed out. The online monitor’s serial number, the date of the calibration, correlation coefficients and analysts signature must be noted on the graph.
11.3.5 Re-correlation requirements
Re-correlation will be required after the alternative analysis instrument has been recalibrated. In addition, re-correlation is required if the online monitor has been serviced, damaged, repaired or interfered with. Re-correlation is also required if validation checks show this is required, as detailed in 10.3.6 below, or if there is a significant change in the composition of make-up of the discharged produced water stream.
11.3.6 Validation
Validation of the online monitor’s performance should be carried out on a weekly basis. This step is important as it gives an indication of any early drift or calibration problems.
A validation is carried out by taking three samples and analysing those using the approved method. An average reading is then obtained from the online monitor during the period when the corresponding samples were taken. The results are then plotted onto the correlation graph. If the results are within the 95% confidence interval, then it is acceptable to keep using the correlation graph. If not, another check must be carried out and if the latest point is within the 95% confidence intervals, then it is acceptable to keep using the correlation graph. If the latest point is outside the 95% confidence intervals, a new correlation graph must be established.
11.3.7 Monthly correlation graph update
At the end of each calendar month, a new correlation graph should be constructed by adding the latest validation data points to the original correlation data points and establishing new 95% confidence intervals. The reason for doing this is that over a period of time the correlation graph will cover a reasonably wide concentration range and it also partially addresses the issue of correlation graph validity against time.
11.3.8 Approval from DECC
Although it is expected that in the majority of cases, online analysers would be used for process monitoring, following the successful generation of a correlation graph, the operator may wish to seek formal approval from DECC to report oil in water figures obtained from an on-line monitor in lieu of manual sampling and analysis methods. Such approval will be granted on a case-by-case basis. Before an online monitor is approved by DECC, oil in water sampling and analysis should continue using the approved alternative method or OSPAR Reference Method until the reporting of data from the online monitor is deemed reliable by DECC.
11.3.9 Reporting of oil in water data from an online monitor
Online monitors gather data continuously. It is important that an accurate monthly average dispersed oil in water figure can be calculated. The oil in water figures reported to DECC must be in terms of the OSPAR Reference Method.
Day to day oil in water calculations may be complicated by the fact that it is the alternative analysis method that has been correlated against the OSPAR Reference Method and not the online monitor. In this instance it will be necessary to obtain (i) the oil in water concentration in terms of the alternative method using the online analyser / alternative analyser correlation graph, and (ii) the oil in water concentration in terms of the OSPAR Reference Method using the alternative analyser / GC-FID analyser correlation graph.
It is important to note that oil in water values greater than 100mg/l must be reported to DECC by submitting a PON1 or OPPC non-compliance form. An online analyser may record many values above 100mg/l during, for example, during ongoing periods of process plant upsets. Therefore, if an on-line analyser is used by an operator for reporting purposes, an agreement should be reached with DECC regarding reporting of produced water values exceeding 100mg/l.
11.3.10 Dealing with online monitor breakdown
If an online monitor breaks down, or is considered to be unreliable, there must be an immediate return to a DECC approved sampling and analysis programme as detailed in the oil discharge permit conditions.
11.3.11 Responsibility
It remains the responsibility of the oil discharge permit holder to ensure that the correlation procedure is carried out correctly and adhered to.
11.3.12 Other correlation approaches
Other correlation approaches may also be used providing that it can be demonstrated that there is no statistically significant difference between the results obtained from the online monitor and those obtained from a DECC approved reference method.
A worked example that shows how to correlate online oil in water analysers against an alternative analysis method is given in Appendix B.
12 BI-ANNUAL PRODUCED WATER SAMPLING AND ANALYSIS
There is a requirement for sampling and analysis, on a bi-annual basis, of produced water samples for:
(i) Total Aliphatics.
(ii) Total Aromatics.
(iii) Total Hydrocarbons.
(iv) BTEX (Benzene, Toluene, Ethyl Benzene and Xylene).
(v) NPD (Napthalene, Phenanthrene and Dibenzothiophene, including C1-C3 Alkyl Homologues).
(vi) 16 EPA PAH’s (excluding Naphthalene and Dibenzothiophene).
(vii) Organic Acids (Total Organic Acids, Formic, Acetic, Propionic, Butanoic, Pentanoic and Hexanoic Acids).
(viii)Phenols / alkyl phenols (Total Phenols, C0-C3 Phenols, C1, C2, C3, C4, C5, C6, C7, C8, C9 Alkyl Phenols plus Homologues).
(ix) Metals (Arsenic, Cadmium, Chromium, Copper, Lead, Mercury, Nickel, Zinc).
12.1 Introduction
For the purposes of building up a database of information on the amounts of various constituents of produced water discharged to sea, a condition of certain oil discharge permit requires operators to carry out a bi-annual (twice yearly) sampling and analysis programme of produced water samples discharged from designated sampling points.
The following paragraphs specify how samples should be collected, what the recommended analysis technique is, what the detection limits are and how the results should be reported.
12.2 Bottles required for sampling
12.2.1 PAH analysis
A labelled acid washed sample bottles (1-litre acid washed amber glass bottle containing 1ml of 3% sodium thiosulphate solution). 5ml of 50% hydrochloric acid will also be required for acidification of the sample.
12.2.2 BTEX analysis
A labelled acid washed sample bottles (1-litre acid washed glass bottle.)
12.2.3 Metal analysis (other than Mercury)
A labelled 1-litre acid washed polyethylene bottle required for each sample. 5ml of 50% hydrochloric acid will also be required for acidification of the sample.
12.2.4 Mercury analysis
A 0.5 litre capacity glass sample bottle containing 10 ml of 0.1M potassium dichromate oxidising agent will be required to be supplied to each offshore location. 10-ml aliquots of sulphuric acid will also be required with each sample bottle for sample acidification.
12.2.5 Organic acid (or Volatile Fatty Acid – (VFA)) analysis
A 0.5 litre acid washed amber glass bottle.
12.2.6 Bottles for phenols / alkyl phenols analysis
A 1-litre acid solvent washed amber glass bottle.
12.2.7 Oil in water analysis
A 1-litre solvent washed glass bottle containing 5ml of 50% HCl will be required to be supplied to the offshore location.
12.3 Packaging
All bottles should be packaged in suitable containers that are in accordance with the relevant dangerous goods restrictions for airfreight. A suitably qualified person should complete the paperwork for transportation of the bottles by air.
12.4 Sampling Methods
12.4.1 General
Samples must be taken from sample points identified within the relevant oil discharge permit and in the same manner as described section 4.14 and as amended below. Sample bottles must not be rinsed out prior to sampling as some of the sample bottles may already contain small amounts of preservation reagents. All samples should be labelled to show details of the date, time, location and installation from which the sample was taken.
12.4.2 PAH analysis
A 1-litre acid washed amber glass bottle marked "PAH analysis" should be filled (leaving no air gap) with a representative sample from the discharge point. The entire contents of the hydrochloric acid ampoule should be added slowly to the sample, the lid should be secured and the bottle should be checked for leaks. The bottle should be inverted six times to ensure thorough mixing.
Note: Appropriate safety precautions should be taken when adding the acid. (See chemical MSDS.) Always add acid to water, never water to acid.
12.4.3 BTEX analysis
A 1-litre acid washed glass bottle marked "BTEX analysis" should be filled (leaving no air gap) with a representative sample from the discharge point. The lid should be secured and the bottle should be checked for leaks.
12.4.4 Metal analysis (other than Mercury)
A 1-litre polyethylene bottle marked "Metals Analysis" should be filled to the mark with a representative sample from the discharge point. The entire contents of the hydrochloric acid ampoule should be added slowly to the sample, the lid should be secured and the bottle should be checked for leaks. The bottle should be inverted six times to ensure thorough mixing. .
Note: Appropriate safety precautions should be taken when adding the acid. (See chemical MSDS.) Always add acid to water, never water to acid.
12.4.5 Mercury analysis
A 0.5 litre glass sample bottle marked "For Mercury Analysis" should be filled to the 0.5 litre mark with a representative sample from the discharge point. The entire contents of the sulphuric acid ampoule should be added slowly to the sample, the lid should be secured and the bottle should be checked for leaks. The bottle should be inverted six times to ensure thorough mixing. .
Note: Appropriate safety precautions should be taken when adding the acid. (See chemical MSDS.) Always add acid to water never water to acid.
12.4.6 Organic acid
A 0.5 litre acid washed amber glass bottle marked “VFA analysis” should be filled (leaving no air gap) with a representative sample from the discharge point. The lid should be secured and the bottle should be checked for leaks.
12.4.7 Phenols / alkyl phenols analysis
A 1-litre solvent washed amber glass bottle marked “Phenols / alkyl phenols analysis” should be filled to the 900ml mark with a representative sample from the discharge point. The lid should be secured and the bottle should be checked for leaks.
12.4.8 Oil in water
A 1-litre glass bottle marked "For oil in water" should be filled to the 1-litre mark with a representative sample from the discharge point. The entire contents of the hydrochloric acid ampoule should be added slowly to the sample, the lid should be secured and the bottle should be checked for leaks. The bottle should be inverted six times to ensure thorough mixing.
Note: Appropriate safety precautions should be taken when adding the acid. (See chemical MSDS.) Always add acid to water never water to acid.
12.5 Analysis Methods
12.5.1 PAH Analysis
|
PAH analysis to include: |
Other components to quantify: |
|
Naphthalene |
Dibenzothiophene |
|
Acenaphthylene |
1-methyl naphthalene |
|
Acenaphthene |
2-methyl naphthalene |
|
Fluorene |
9-Methylphenanthrene |
|
Phenanthrene |
4-Methyldibenzothiophene |
|
Anthracene |
2,6 Dimethyl naphthalene |
|
Fluoranthene |
9-Ethylphenanthrene |
|
Pyrene |
4-Ethyldibenzothiophene |
|
Benz(a)anthracene |
Trimethylphenanthrene |
|
Chrysene |
2-Isopropylnapthalene |
|
Benzo(b)fluoranthene |
1,2,6 - Trimethylphenanthrene |
|
Benzo(k)fluoranthene |
Other isomers as appropriate |
|
Benzo(a)pyrene |
|
|
Indeno(1,2,3-cd)pyrene |
|
|
Dibenz(a,h)anthracene |
|
|
Benzo(g,h,I)perylene |
|
When the on-shore laboratory receives the samples, they should be dosed with at least two internal standards that reflect the different number of rings present i.e. at least one two-ring and one three-ring internal standard should be used. The samples should then be solvent extracted, and the extract concentrated by evaporation and analysed by GC/MS/MS with the sample components separated, identified and measured by injecting an aliquot into a high-resolution fused silica capillary column. The method of analysis will be based on a draft ISO standard, ISO WD 14653-2:1997, “Water quality – Determination of Polynuclear Aromatic Hydrocarbons (PAH) – Part 1: Determination of 16 PAH in water by gas chromatography with mass spectrometric detection” or US EPA 610.
Further details on this method are available in OSPAR paper OIC 04/3-2 presented by Denmark at OIC 2004. Seehttp://www.ospar.org/eng/html/welcome.html for further details, check the DECC website (https://www.gov.uk/government/organisations/department-of-energy-climate-change) or contact DECC for a copy.
The UK detection limit for PAH is 0.1mg/l.
12.5.2 BTEX analysis (Benzene, Toluene, Ethyl Benzene, (o,m,p Xylene))
Analysis will be carried out by a headspace method based on GC/MS. The method is described in ISO method 11423-1- “Water-quality Determination of benzene and some derivatives. Part 1: Head-space gas chromatographic method”. In addition it is recommended to use mass spectrometry as the detection technique and labelled internal standards for quantification. Further details on this method are available in OSPAR paper OIC 04/3-2 presented by Denmark at OIC 2004. or contact DECC for a copy.
The UK detection limit for BTEX is 1.0 mg/l.
12.5.3 Metals (Cd, Pb, Zn, Ni, As, Cr, Cu)
The samples will be filtered prior to analysis. The samples will be analysedusing Inductively Coupled Plasma-Atomic Emission Spectrometry (ICP-AES), Atomic Absorption Spectroscopy (AAS), Dynamic Reaction Cell Inductively Coupled Plasma Mass Spectroscopy (DRC-ICP-MS), High Resolution Inductively Coupled Plasma Mass Spectroscopy (HR-ICP-MS), Hydride Generation Atomic Absorption Spectroscopy (HG-AAS), or Inductively Coupled Plasma Mass Spectroscopy (ICP-MS). The samples will be diluted with de-ionised water to reduce the sodium level; this may include a pre analysis to determine the Na content.
After dilution, the samples will be analysed using the appropriate element wavelengths, which are sensitive, free from interference and are linear in the calibration range. The latter will be assured by analysing a quality control sample, which is generally at mid point of the concentration range and prepared from an alternative batch to that of the standard.
Since the sample matrix is unknown, some samples may require different dilutions and so the detection limit can either be improved or eroded. If applicable, a combination of matrix matching of reference standards and dilution should be used to improve detection limits.
Voltammetry is another technique that may be suitable for the analysis of metal ions in produced water. It is well suited to saline matrices and can achieve lower detection limits than some of the ICP techniques since large dilutions are not required to eliminate salinity issues.
The UK detection limit for Cd is 0.5 mg/l.
The UK detection limit for Pb is 1 mg/l.
The UK detection limit for Zn is 5 mg/l.
The UK detection limit for Ni is 9 mg/l.
The UK detection limit for As is 1 mg/l.
The UK detection limit for Cr is 1.5 mg/l.
The UK detection limit for Cu is 10 mg/l.
12.5.4 Phenols / alkyl phenols content
Total Phenols, C0-C3 Phenols, C1, C2, C3, C4, C5, C6, C7, C8, C9 Alkyl Phenols plus Homologues will be determined by GC-MS.
The UK detection limit for alkyl phenols is 0.1mg/l.
12.5.5 Organic acid content
Formic, acetic, proprionic, butanoic, pentanoic and hexanoic organic acids should be determined by GC-MS or by Ionic chromatography, isotachophoresis (ITP).
The UK detection limit for organic acid is 2 mg/l.
12.5.6 Mercury content
Mercury should be determined using ICP-AES, i.e. Elemental Hg will be generated using SnCl2/Au-amalgamation, or Cold Vapour Atom Absorption Spectroscopy (CV-AAS). The method of standard addition should be used for this analysis.
As described in section 11.5.3 voltammetry is another technique that may be suitable for the analysis of Mercury in produced water.
The UK detection limit for Hg is 0.5mg/l.
12.5.7 Oil in water content
The analysis should be carried out using the DECC Triple Peak method to provide total oil in water, aliphatic and aromatic content (for details please refer to Section 7 of this document).
12.6 Reporting of test results
The appropriate bi-annual analysis EEMS form must be completed for each discharge point and submitted to the processing authority by 1st September and 1st March of each year for the reporting periods 1st January – 30th June and 1st July – 31st December respectively. It is highly recommended that samples are collected during the middle part of each reporting period in order to avoid delays caused by unexpected process issues.
Late submission of returns is a non-compliance with the OPPC Regulations and must also be reported using an OPPC non-compliance form.
13 HYDROCARBON ANALYSIS OF NON-PRODUCED WATER DISCHARGE STREAMS
There are many potential non-produced water hydrocarbon discharge sources from an offshore installation and there is not always an agreed reference analysis method that can be recommended for these additional hydrocarbon sources. The following information is offered as ‘best practice’ and should be used wherever possible.
13.1 Measurement of Crude Oil on Water Based Mud Drill Cuttings
When drilling through the oil-bearing section of a reservoir using water-based mud, the drill cuttings could become contaminated with traces of crude oil. The measurement of crude oil on water based mud drill cuttings is therefore considered to be important, as this is a permitted activity under the OPPC regulations.
The retort analysis method is the current accepted UK analysis technique. Other techniques such as Gas Chromatography – Mass Spectrometry (GC-MS), Gas Chromatography Flame Ionisation Detection (GC-FID) or Fourier Transform Infrared Spectroscopy (FT-IR) may be used if it is not possible or practical to use the retort method.
13.2 Measurement of hydrocarbons on thermally treated Organo-Phase Fluid (OPF) drill cuttings
OSPAR Decision 2003/3 allows for the discharge of 1% or less of synthetic oil on OPF drill cuttings. The discharge of OPF cuttings that have been treated so that they contain 1% of oil or less, (w/w) is a permitted operation under The Offshore Chemicals Regulations 2002 (OCR).
Note: This is not a discharge normally covered by the OPPC regulations although an oil discharge permit will be required for the discharge of fluids associated with any cuttings treatment, e.g. Rotomill, which contain reservoir hydrocarbons which is distinguishable from synthetic oil using a recommended analysis method shown below.
Details of the appropriate limits of treated OPF drill cuttings should be contained in the relevant section of the PON15 designated to cover chemical use and/or discharge operations for that particular operation. Further guidance on sampling, etc, is available from the DECC Environmental Management Team
Following appropriate solubilisation of the OPF from drill cuttings, DECC recommends using either Gas Chromatography – Mass Spectrometry (GC-MS), Gas Chromatography – Flame Ionisation Detection (GC-FID) or Fourier Transform Infrared Spectroscopy (FT-IR) (or a combination of these techniques) as a means of quantifying the levels of synthetic hydrocarbons present on discharged OPF cuttings. These methods may also be suitable for determining the amount of reservoir hydrocarbons contained on the cuttings.
13.3 Measurement of crude oil on sand or scale
DECC recommends that the DECC IR method be used for this type of analysis. The analyst will have to measure out a portion of the oily sand/scale and then use TTCE solvent to extract the oil phase retained on the sand/scale. Results should be reported in mg/kg. A representative sample of crude oil must be used when constructing the calibration graph. Refer to Annex A of the DECC IR Method (section 5) for details of oil on sand analysis. In actual laboratory testing of oil contaminated sand or scale, if the DECC IR Method is not suitable/available, other types of analysis using e.g. FT-IR or GC/MS or different solvent systems may prove more suitable. In this instance, the appropriate DECC Environmental Inspector should be contacted. Note that oil on sand analysis is not to be correlated to the OSPAR Reference method.
13.4 Measurement of oil in hazardous and non-hazardous drainage systems
Discharges of hydrocarbons from hazardous and non-hazardous drains caissons are a permitted activity under the OPPC regulations. Hydrocarbon discharges from drains must not contain more than 40mg of hydrocarbons per litre (40mg/l) in discharged water on a monthly average basis.
DECC recommends that samples taken for the purpose of measuring the oil content of discharges from hazardous and non-hazardous drains be analysed by the DECC IR Method. If the DECC IR Method is not suitable other types of analysis using e.g. FT-IR or GC/MS or different solvent systems may prove more suitable. In this instance, the appropriate DECC Environmental Inspector should be contacted. Note that analysis of oil in drains systems is not to be correlated to the OSPAR Reference method.
13.5 Measurement of hydrocarbons in well-bore clean-up samples
Under the Prevention of Oil Pollution Act, (1971), exemptions from Section 3 of the Act were granted to allow for the discharge of hydrocarbon contaminated seawater, or brine, that resulted from the chemical cleaning of a well, prior to the addition of completion brines. Given that the hydrocarbons being removed in well clean-ups are either residual organo-phase fluids (OPF’s), or some of the components of the original OPF used to drill the well, discharge of such hydrocarbons now falls under the auspices of OCR. However, an oil discharge permit will be required for the discharge of well clean up fluids which contain reservoir hydrocarbons which is distinguishable from synthetic oil using a recommended analysis method shown below.
Details about appropriate limits for the discharge of hydrocarbons contained in contaminated seawater or brine should be contained in the relevant section of the PON15 designated to cover chemical use and discharge operations for that particular operation and analysts are again referred to the DECC Environmental Management Team for further information on sampling, reporting, etc.
DECC recommends using either Gas Chromatography – Mass Spectrometry (GC-MS), Gas Chromatography – Flame Ionisation Detection (GC-FID) or Fourier Transform Infrared Spectroscopy (FT-IR) (or a combination of these techniques) as a means of quantifying the levels of hydrocarbons present on discharged well cleanup samples. If no OPF’s are expected within the well clean up fluids, then the DECC IR method may be used to quantify the level of reservoir hydrocarbons within the discharge samples.
Care must be taken, when analysing well bore clean-up returns, to remove all or most of the surfactants present as they may register as hydrocarbons in the overall analysis. This may be achieved by using recognised sample clean-up techniques utilising Florisil for example.
APPENDICES – WORKED EXAMPLES ILLUSTRATING CORRELATION METHODS DEVELOPED IN CHAPTER 8
The data used in the worked examples below are hypothetical, and therefore do not represent real oil in water data. The examples have been created for the purpose of demonstrating the principals involved in correlating one method against another.
The calibration graphs with the 95% confidence intervals calculated in the worked examples below have been generated using a statistical software package called Minitab and Version 14 which was used by DECC for creation of this document. Use of this software by DECC does not constitute a recommendation and analysts are free to use other suitable software packages that can carry out similar tasks. DECC experience on how to generate suitable graphs using Minitab is offered within this document. However analysts would be well served in obtaining professional advice in this area and not just relying upon DECC experience.
Use of Minitab 14
Generating graphs correlating Alternative Analysis results against OSPAR reference results is quite straightforward using Minitab. Data can be copied from an Excel or Word document and pasted directly onto a Minitab worksheet. If you go to ‘Stat’ on the toolbar and select ‘Regression’ followed by ‘Fitted Line Plot’, this will take you into a Fitted Line Plot menu. OSPAR Reference Method analysis results go into the X (Predictor) axis and results for the Alternative analyses go into the Y (Response) axis. Under Options the box for the 95% Confidence Interval should be ticked. Once this has been done, select OK from the main Fitted Line Plot menu. A graph should appear that contains both the 95% Confidence Intervals and has the regression equation at the top.
Adding validation data is straightforward but it has to be remembered that all data in the columns will be used in the graph and in preparation of the regression equation. This is useful when generating a new plot after removing an outlier for example but can be awkward if trying to overlay validation data points to see if they fit into the existing graph.
A simple way of checking whether data is within or out with the 95% confidence interval is to go to the ‘Editor’ function and select ‘Crosshairs’. It is then relatively easy to see whether data points lie within the 95% confidence intervals.
Any comments on the use of Minitab 14 or any other statistical package, in relation to this document, should be sent to
Correlating an Alternative Method against the OSPAR Reference Method using Laboratory Prepared Correlating Standards
It is October 2009 and EDU Limited has decided that they want to use an alternative oil in water analysis method to the OSPAR Reference Method on their offshore installation Atholl Bravo but they wish to use method A2.
The operator has decided that UK Central Laboratories should carry out the onshore correlation of the alternative method instrument against the OSPAR Reference Method. The alternative method instrument was despatched to the onshore laboratory together with a representative sample of stabilised crude oil.
For the alternative method, n-pentane is used as an extraction solvent.
(1) Correlation standards preparation
At the onshore laboratory, a stock solution of oil in water was prepared by introducing a known weight of stabilised crude oil into a known volume of saline water. This was followed by pentane extraction. A series of six calibration standards were then prepared by successive dilutions of the pentane extract using pentane.
(2) Analysis results
Correlation standards were then analysed by both the alternative method and the OSPAR Reference Method. Results obtained are shown in Table A1.
|
Alternative Method (mg/l) |
4 |
15 |
33 |
43 |
61 |
70 |
|
OSPAR GC-FID (mg/l) |
3 |
16 |
30 |
45 |
60 |
76 |
Table A1: Analysis of correlation standards
(3) Correlation curve construction
A correlation graph was constructed by plotting the results shown in Table A1. The points were then fitted using linear regression with the 95% confidence intervals calculated using Minitab. The resultant graph – Graph A1 is shown:
http://www.joboilfield.com/

